See What Others
Cannot.
Two specialized engines built for the frontier of AI and data science — where traditional tools collapse and structural truth hides in the dimensions they miss.
EOG-HPO
Conquer D>100 dimensional search spaces — 62× better than Bayesian Optimization.
TF-WPSS
Discover regime shifts, causal hierarchies & structural threshold breaks in your data.
Conquer the Curse of
Dimensionality
The only optimization engine built specifically for ultra-high-dimensional spaces where all traditional HPO methods fail. Achieve state-of-the-art results at D>100.
Active Dimensions Detection
Identifies the 5–10 truly impactful parameters in 100+ dimensional spaces.
Exponential Efficiency
10× fewer evaluations vs Bayesian Optimization in D>50 spaces.
Quality Guarantee
Finds solutions orders of magnitude closer to the global optimum.
NAS · AutoML · RL
Built for Neural Architecture Search, AutoML Pipelines, and RL Tuning.
Built for complex AI/ML challenges
Neural Architecture Search
Cell structure, connection patterns, operation types, training hyperparameters.
AutoML Pipeline Optimization
Feature selection, preprocessing, model selection, full hyperparameter tuning.
Reinforcement Learning Tuning
Policy networks, training algorithms, reward shaping, environment interactions.
See the hidden rules
governing your data
Most tools show trends. TF-WPSS reveals the underlying structural laws that govern them.
Theoretical Framework for Weak Signal Structural Synthesis — a desktop AI system that discovers regime shifts, layered causal hierarchies, 3D bent-space topologies, and critical threshold breaks using proprietary Threshold Causal Calculus (TCC).
Regime Detection
Segments data into distinct operational phases.
Causal Hierarchies
Maps temporal cause-effect layers.
3D Bent-Space Topology
Proprietary figures exposing nonlinear dynamics.
Threshold Causal Calculus
Finds critical structural break-points.
Embedded Sub-Features
YouTube Research Alignment
Video ranking and filtration aligned to your research query.
PhD-Level Curriculum Prep
Generate graduate-level structured learning curricula.
Research Paper Summaries
Summarizes papers using structural synthesis.
Watch TF-WPSS in Action
Full System Walkthrough
Live demo on a real quantitative dataset.
3D Topology Visualized
See the bent-space mesh and structural break cube.
TCC Coalition Giants Live
Watch threshold interactions get discovered.
The TF-WPSS Analytics Studio Desktop App
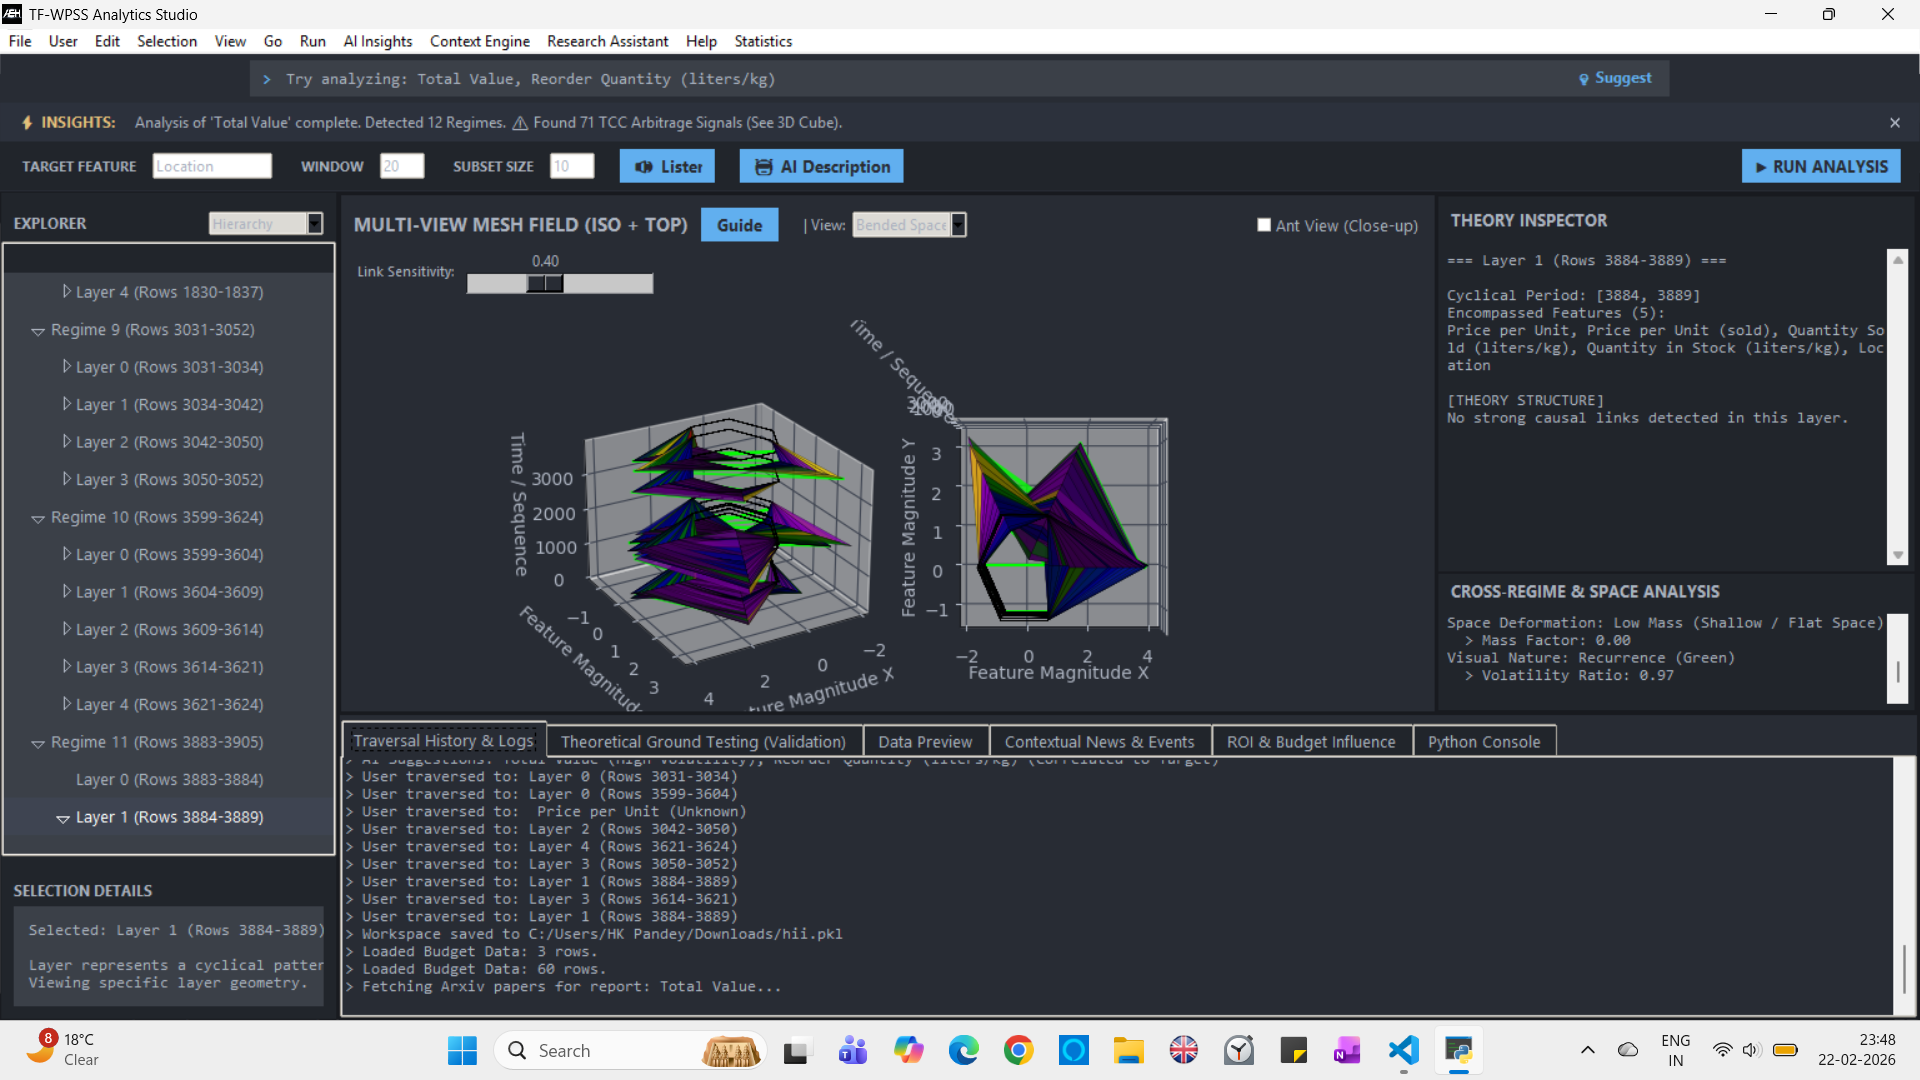
Two Types of 3D Structural Visualization
These are not standard charts. They are proprietary figures generated by TF-WPSS — the only tool that produces them.
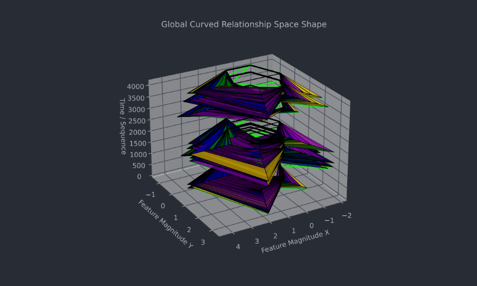
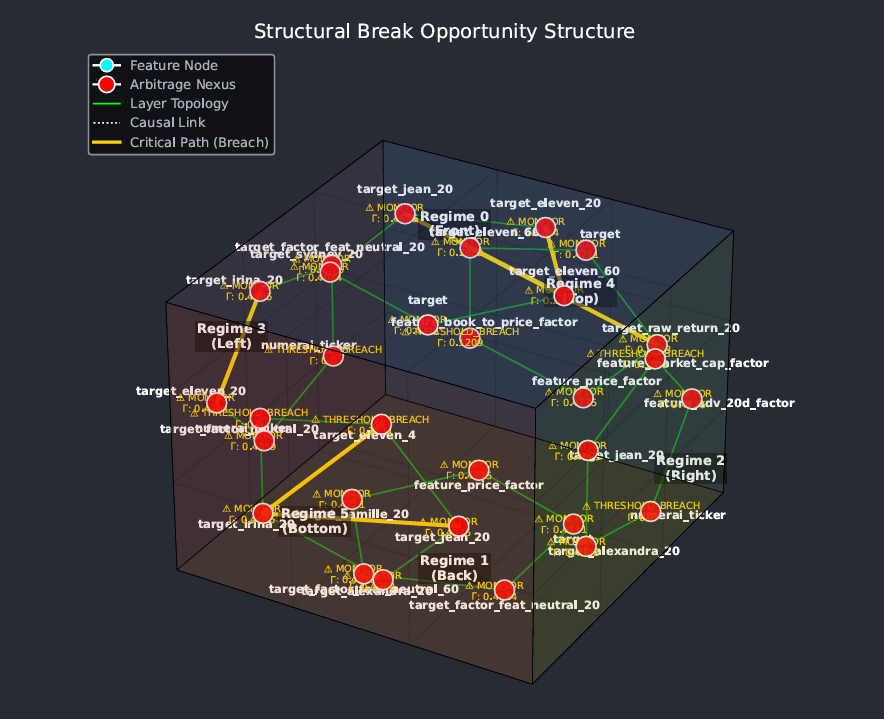
No other analytics tool generates these views. They are outputs of TF-WPSS's proprietary Threshold Causal Calculus — not re-skins of standard plots.
Real-World Example
Dairy Retail · 4,325 rowsCausal layers form a temporal micro-theory of how this dairy operation's early phase actually works.
Multi-feature threshold interactions — genuine hidden structural laws, not random correlations.
Scroll through an actual analysis run
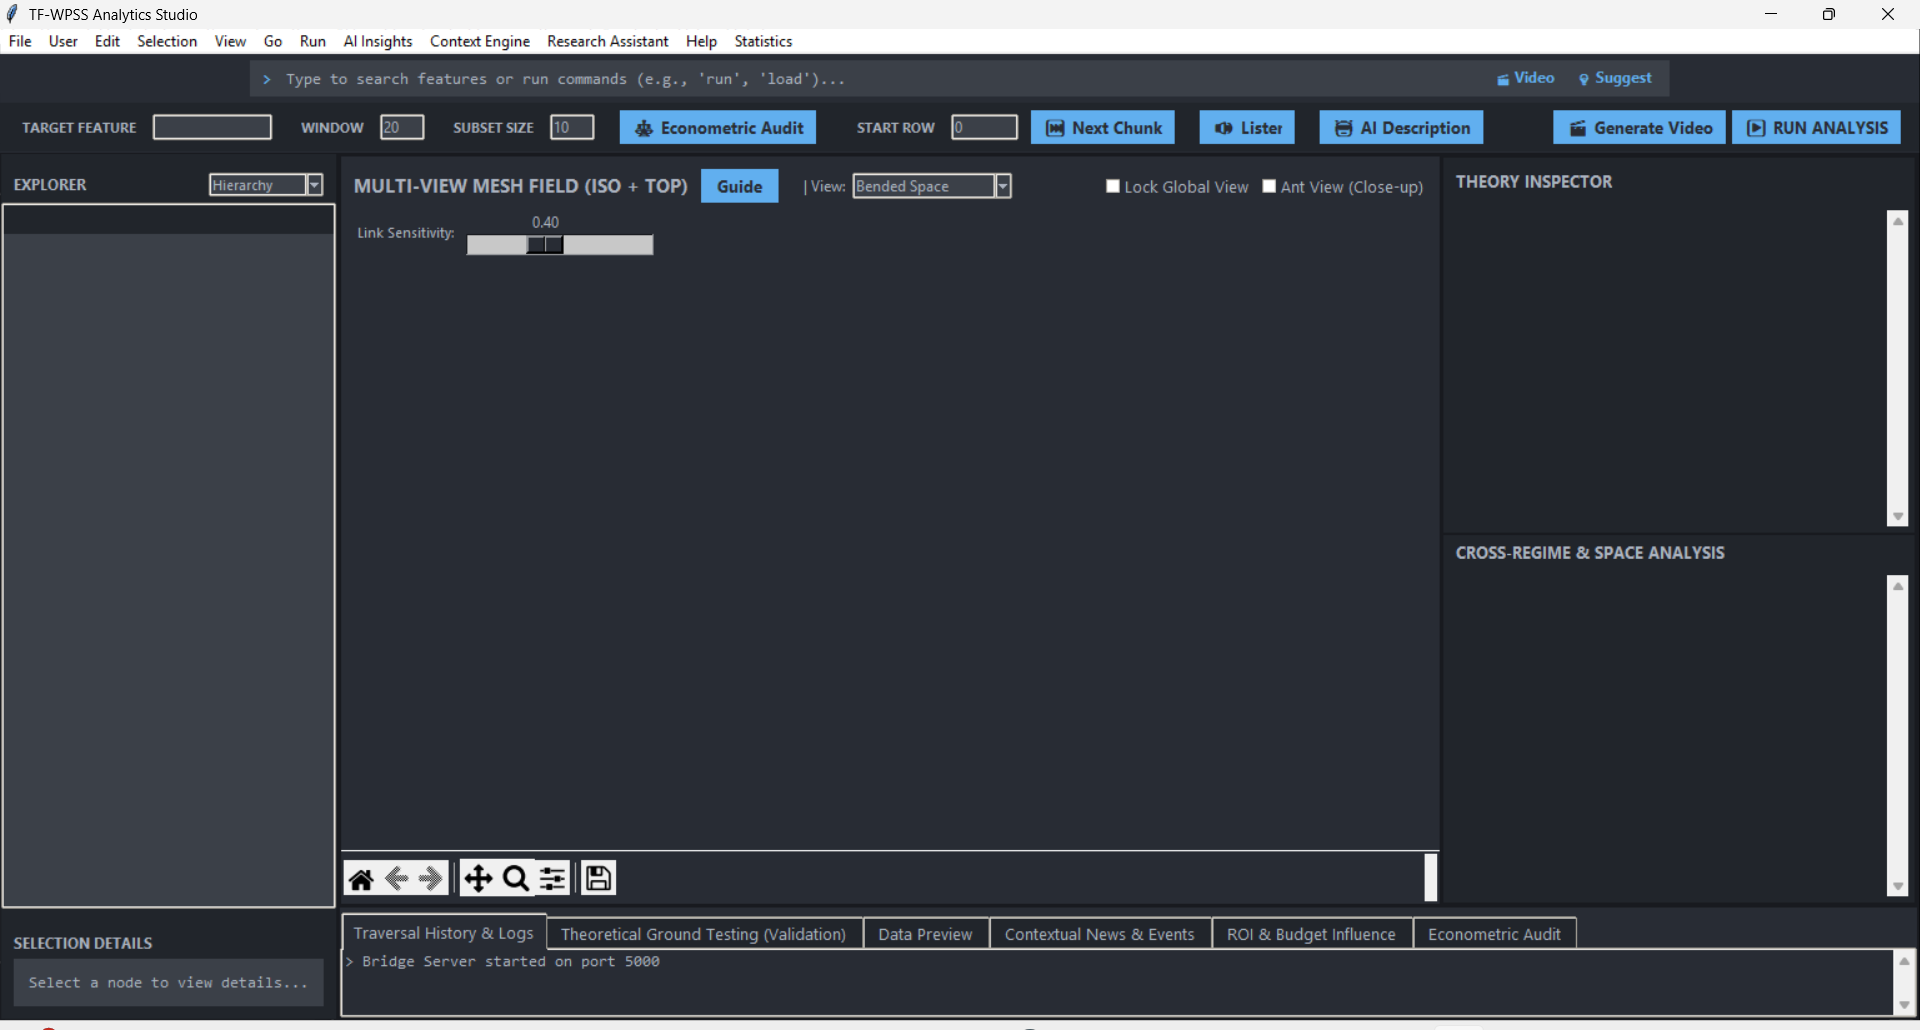
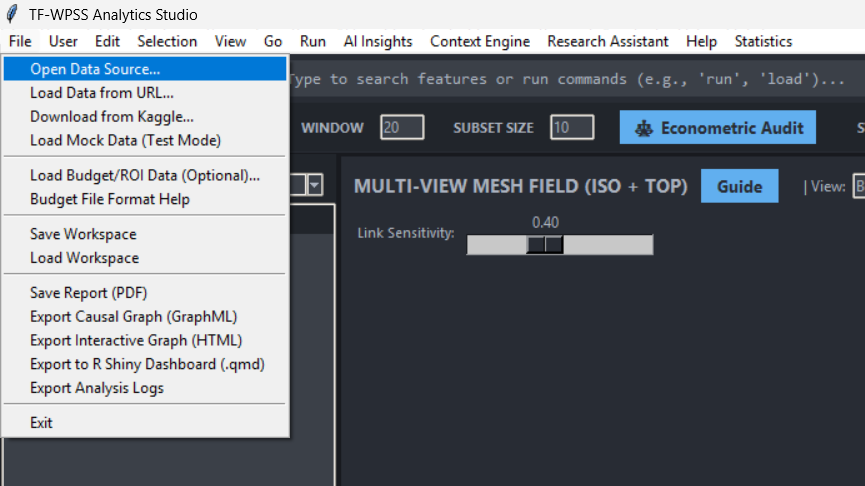
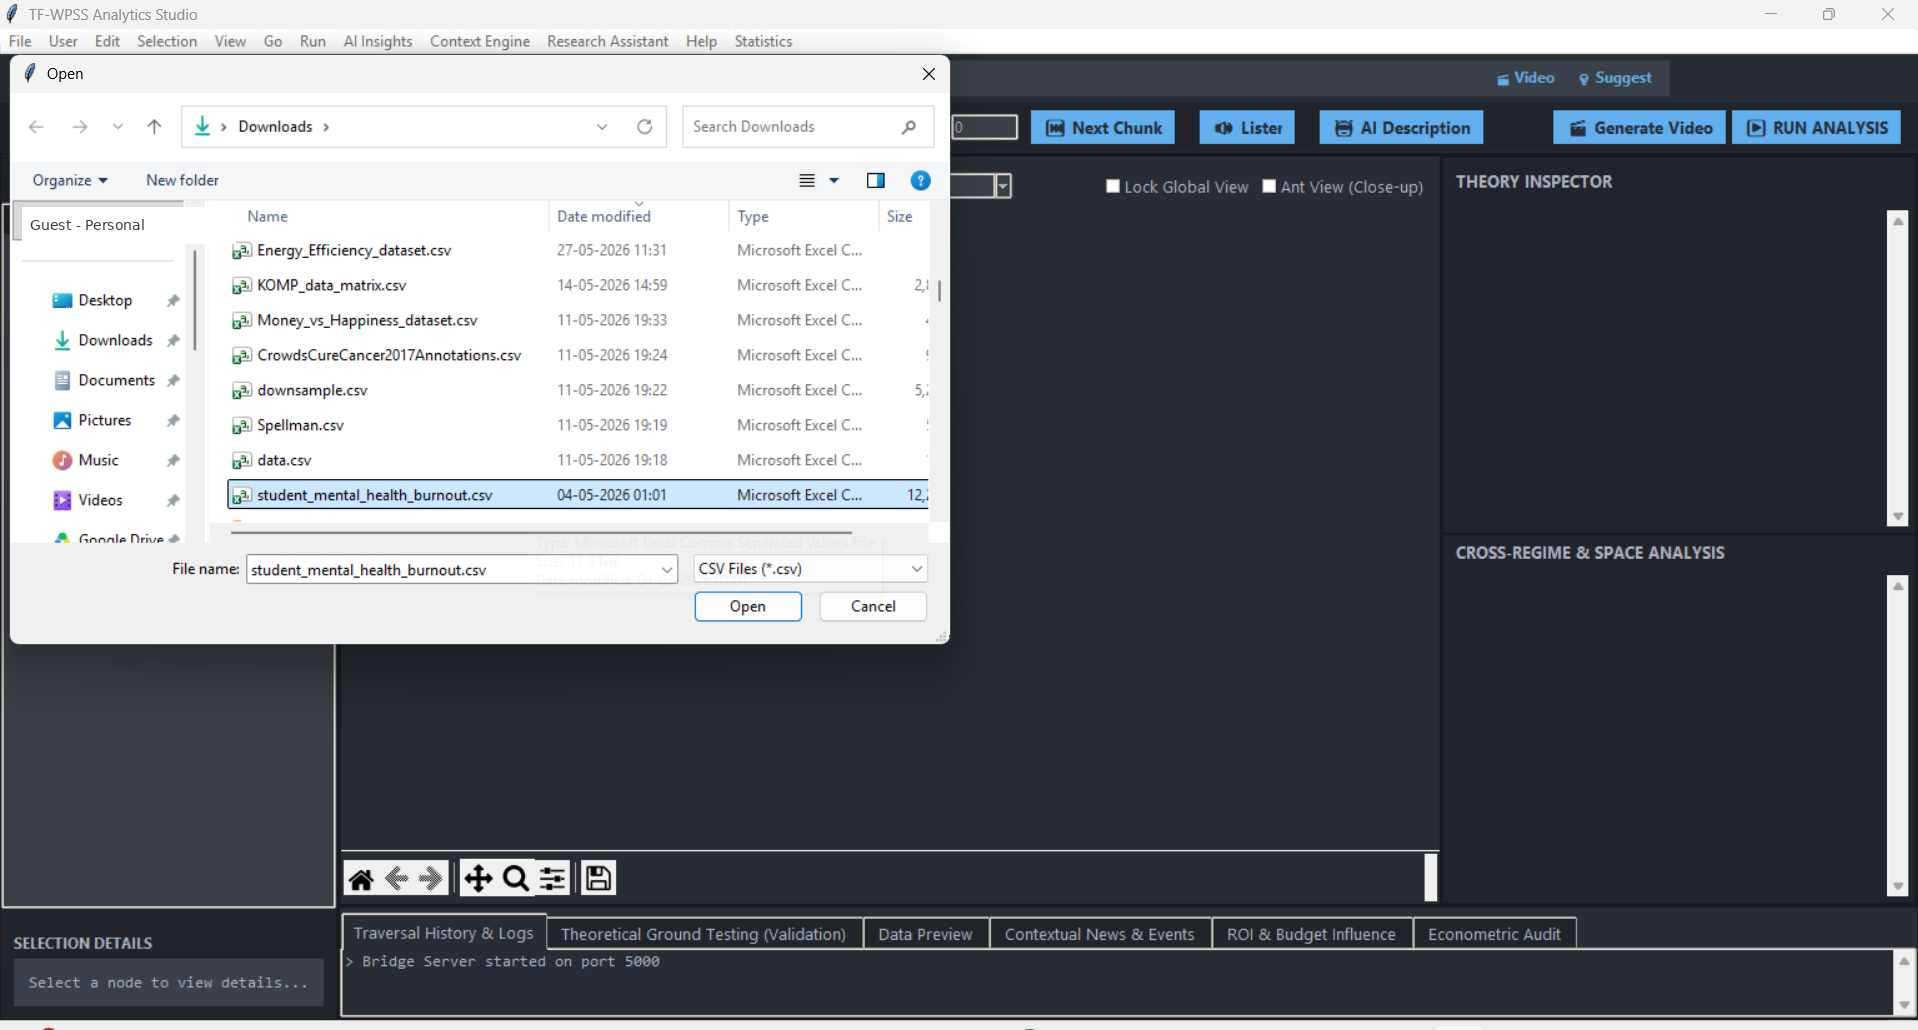
Every frame below is the real TF-WPSS Analytics Studio interface, captured mid-session on a longitudinal student-wellbeing dataset. Keep scrolling — you're driving the session.

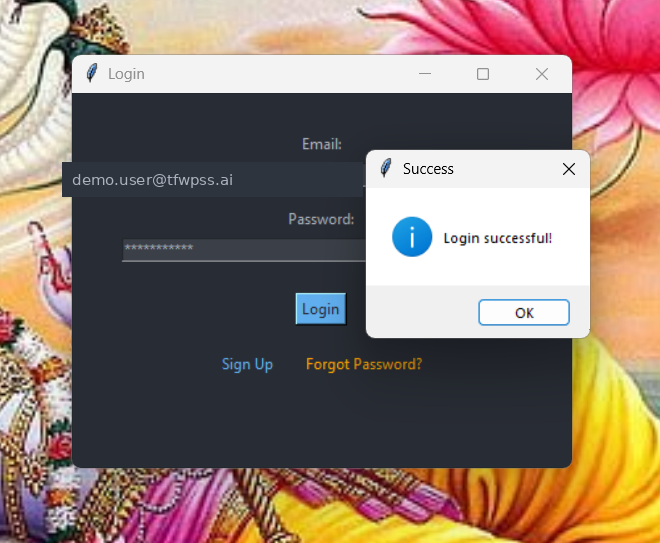

 ZOOMED · RUN TRIGGER
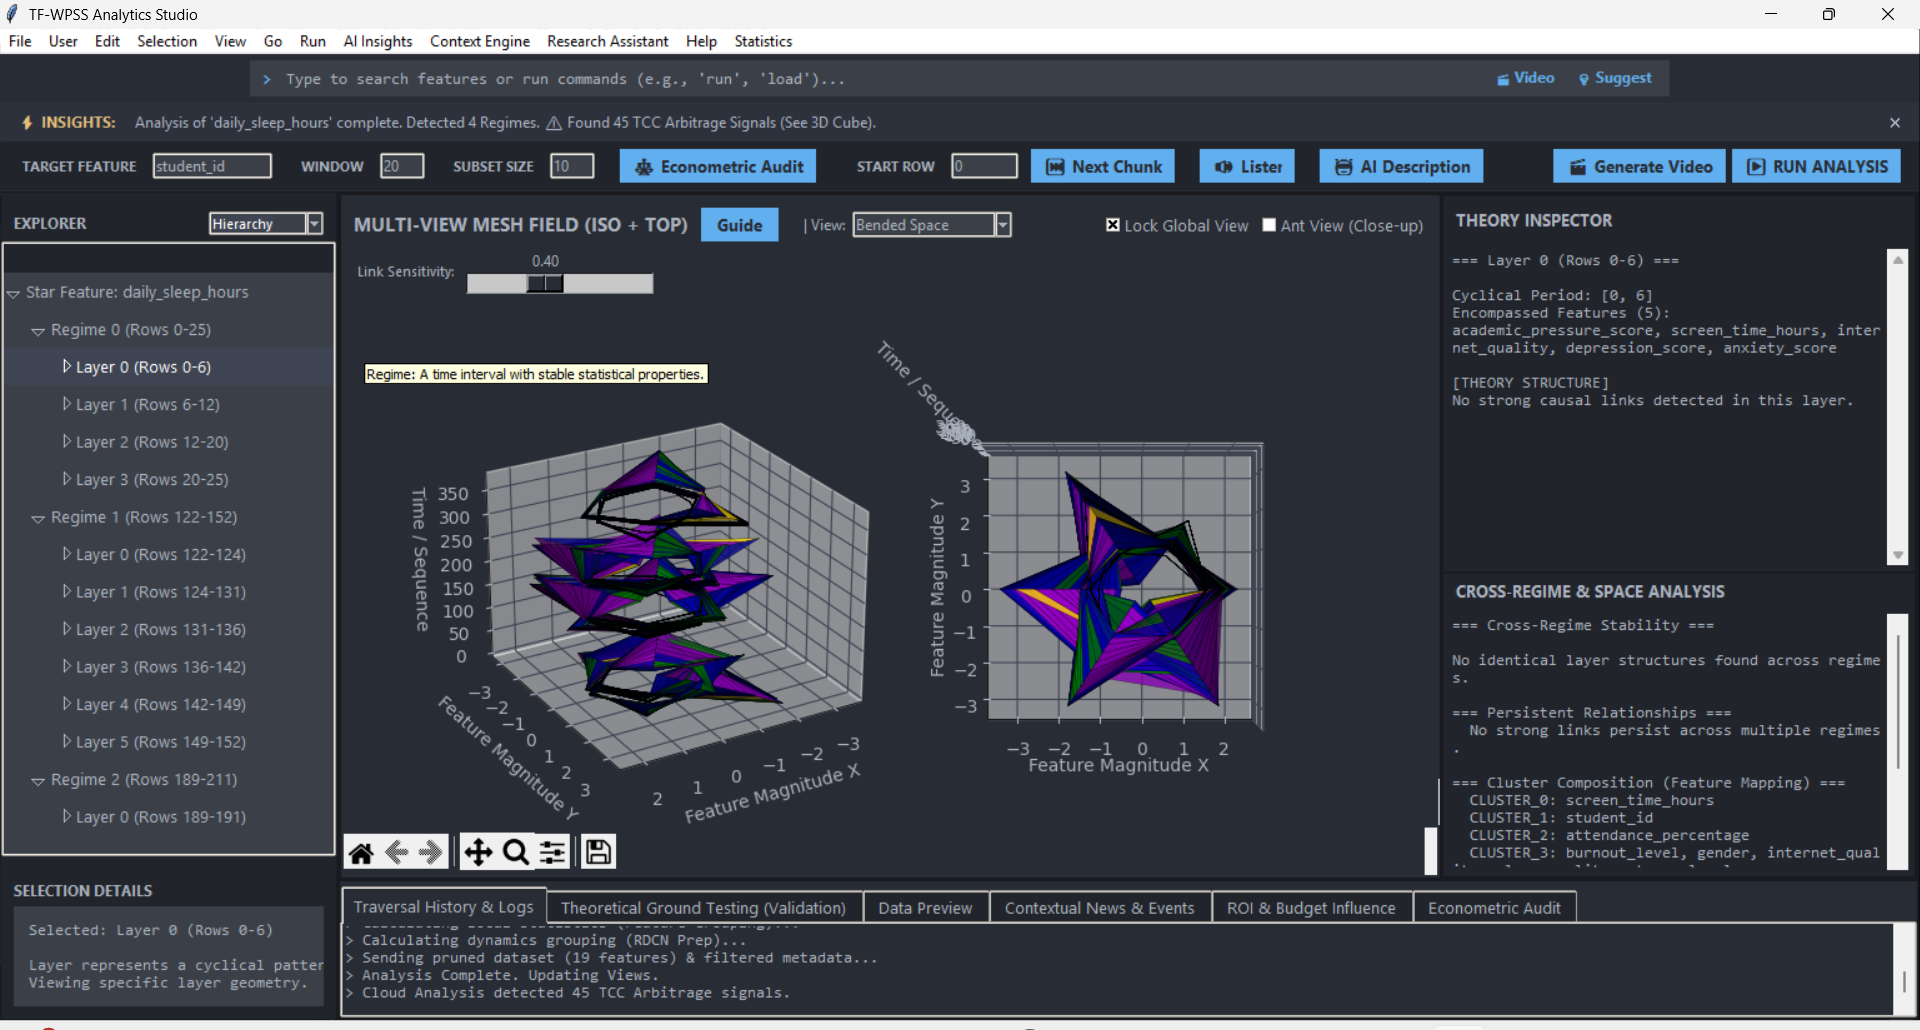
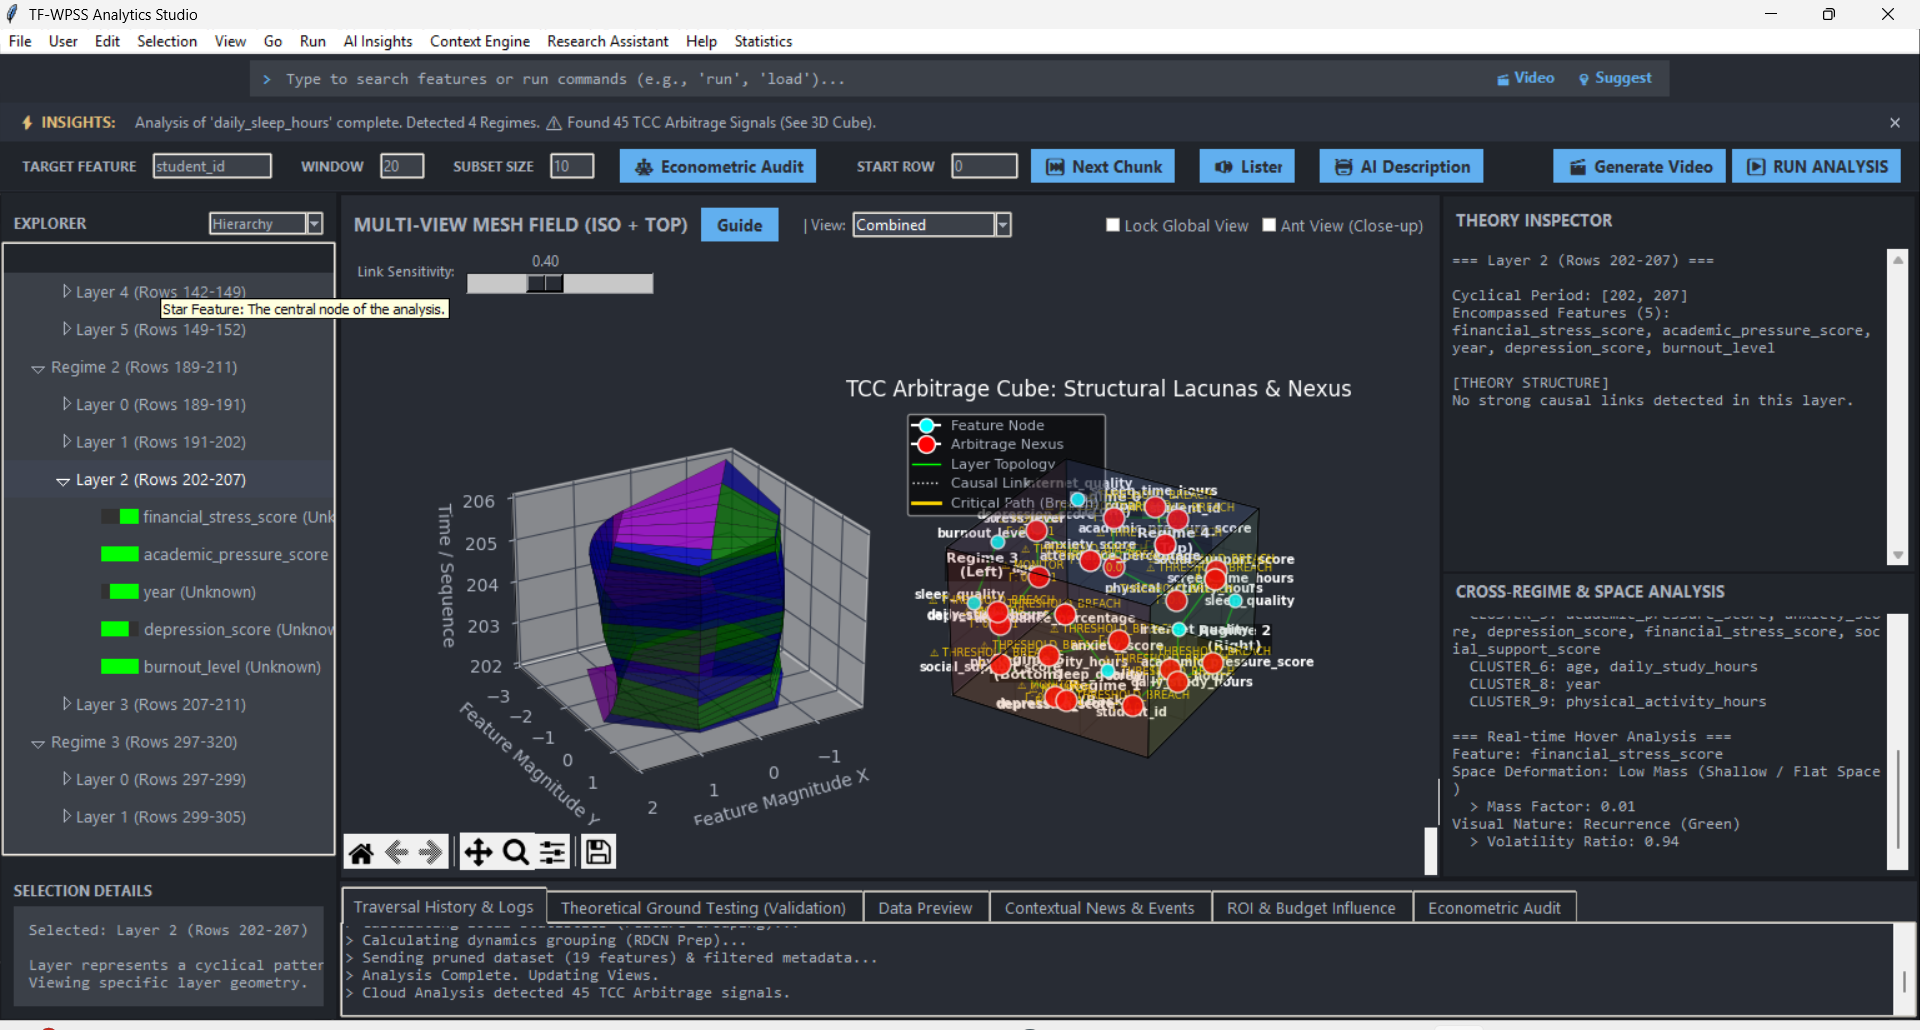
Double-click the desktop icon — TF-WPSS Analytics Studio boots in seconds.
Works with your existing ML workflow
Value-based pricing
Pay for results, not compute time.
Dimensionality-Based Pricing
Desktop Application Licensing
Most Popular
Ready to dominate
high-dimensional optimization?
Join leading AI research labs and enterprises who trust EOG-HPO.
Contact EOG-HPO SalesDiscover your data's
hidden structural laws
Regime shifts, causal hierarchies, and threshold breaks — all revealed.
Request TF-WPSS Access